Global emissions progress
Global emissions progress
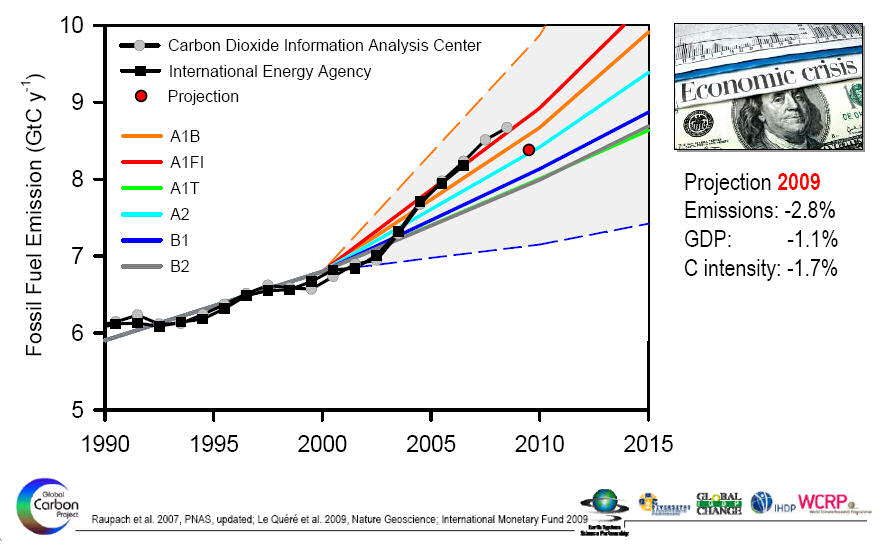
Between 2000-2008 our emissions of carbon dioxide ![These data include carbon emissions from coal, oil, gas and cement production [i]](../images/_info.jpg) were worse than the worst case emission scenarios, which is obviously a worrying start. Since then the global recession is expected to have brought 2009 emissions down. How economic recovery will effect emissions is going to be very important for the future.
were worse than the worst case emission scenarios, which is obviously a worrying start. Since then the global recession is expected to have brought 2009 emissions down. How economic recovery will effect emissions is going to be very important for the future.
The following figure is from "Global Carbon Project (2009) Carbon budget and trends 2008, [www.globalcarbonproject.org, November 2009]" (see The Global Carbon Project website):
- Notice that the shaded area indicates the uncertainty bands around the solid, coloured IPCC emission scenario lines.
- The solid red line is the high emission scenario A1FI.
- The black squares/grey circles are actual global emissions from 1990 to 2008. Notice that emissions have increased from 6.1 billion tonnes of carbon per year (GtC/y) in 1990 to 8.7 GtC/y
![In carbon dioxide equivalent, it is an increase from 22.5 to 31.8 Gt CO2-eq / year. [i]](../images/_info.jpg) which is a 42% increase.
which is a 42% increase. - An estimate for 2009 is also plotted, which shows the effects of the global recession. How we emerge from this will be very important - hopefully we wont spring back into the business as usual activities that were pushing us along the high emission scenario.

International emissions data
For data on how world is responding to the challenge of reducing greenhouse gas emissions:
- The official repository of emissions data is held at the United Nations Framework Convention on Climate Change (UNFCCC) website. Notice that not all countries report their emissions to the UNFCCC.
- The Carbon Dioxide Information Analysis Center (CDIAC) website collates estimates of emissions from all countries.
- You can see how well the European Union is doing EU Greenhouse gas inventory (1990-2007) report.
.jpg)
Return to main Emissions Targets page

![link to W3C validation website, which will show that the stylesheets are Valid CSS [css]](http://jigsaw.w3.org/css-validator/images/vcss-blue)
![link to information about this website [info]](../images/btn_info.jpg)
![jump up to the top of this page [top]](../images/btn_top.jpg)