How UK might influence World targets
If we could persuade the rest of the World to converge with the UK emissions reductions, we might see an optimistic picture developing for the second quarter of the century. It is a big if though! We are going to test our powers of influence to do this. And we certainly wont have much hope of that if we don't meet our own targets.
For such a small country (1% of the global population) our emissions are very high. In 1990, we were responsible for 2.5% of global carbon emissions - making us the 8th largest contributor.

The historical influence of the UK - There are emotive issues to consider as well, which almost certainly influence the rest of the world. It wasn't long ago that we had the privilege of a large and rich empire. Whilst this is gone, it is not forgotten, and it makes it imperative that we aren't seen to be slacking in meeting our emissions reduction targets.

Embedded Emissions - We seem to be increasing our demand for goods manufactured overseas, which are part of our hidden carbon footprint. It looks like we have, in effect, shipped some of our problem abroad, for other countries to count the cost. This is important to consider, as it means that part of the emission targets for those manufacturing countries is really our responsibility.
Global convergence with UK targets

You will need to have read the UK influence on China to understand how the thinking behind this section.
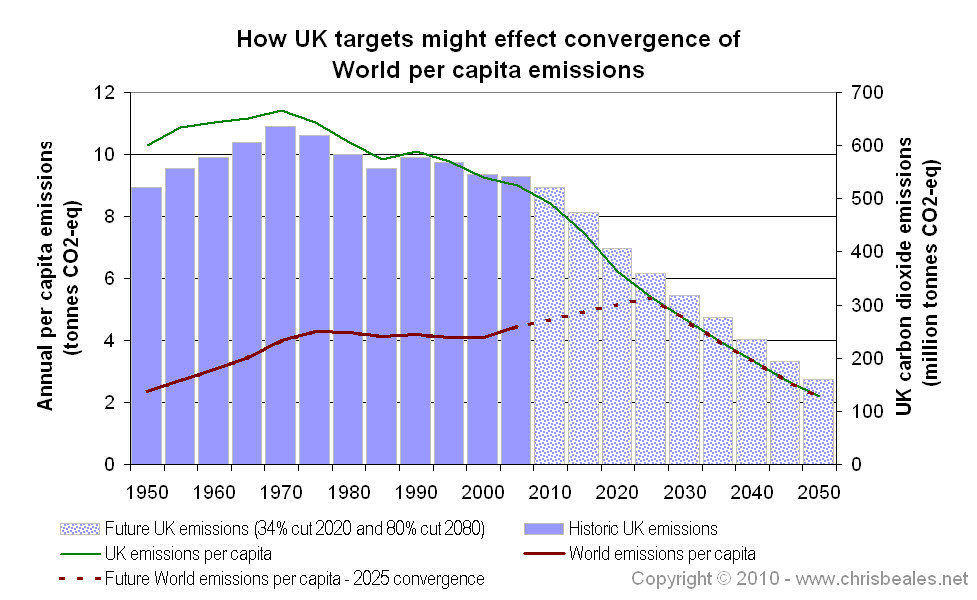
The following figure is similar to that developed with China's per capita emissions. It shows a bar chart of UK CO2, which relate to the values on the right-axis. Overlaying the bar chart are lines of UK and World per capita emissions - these relate to the values on the left-axis. The brown line of the World's per capita emissions has been extended on the assumption that they converge with UK per capita emissions in 2025.

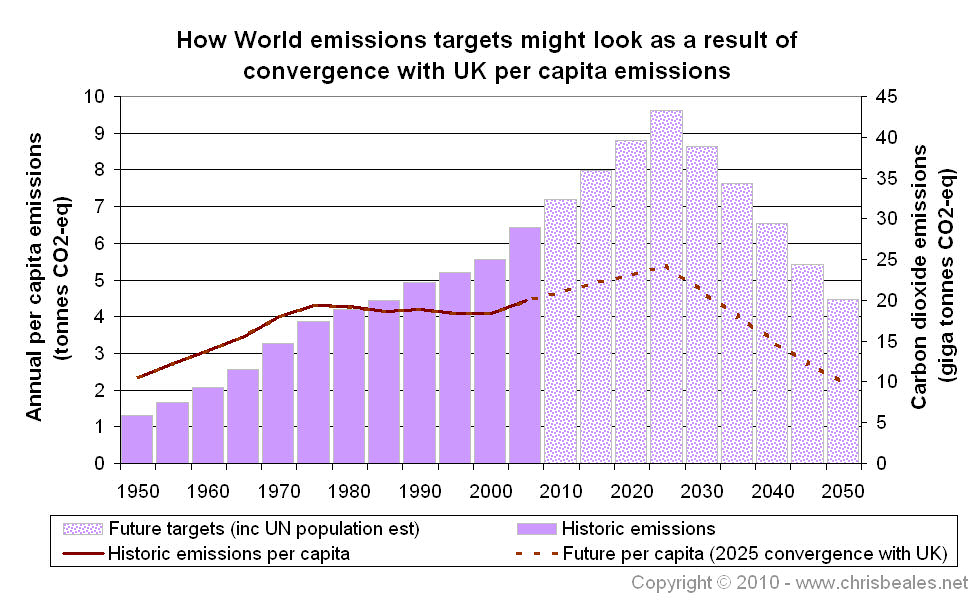
The following figure shows what the World's emissions will look like as a consequence of the per capita trend developed above.
- This has been converted into CO2 emissions by multiplying: the per capita emissions, with the UN population projections for the World.
- If the World followed those emissions: they would peak at 43 Gt CO2-eq (i.e. billion tonnes of CO2 per year) by 2025; and then reduce emissions rapidly by about 920 Mt CO2-eq per year.

Compared to the Emission Scenarios (SRES)

The Consequences pages introduce you to the Special Report on Emission Scenarios (SRES).
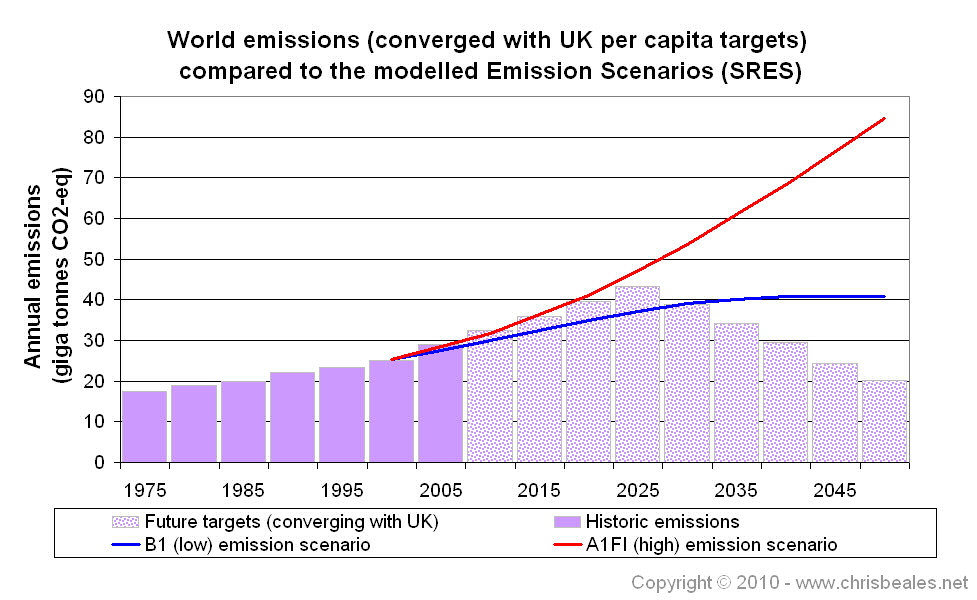
The following graph shows the global emissions, developed above, in comparison with the SRES models.
- If the world matches UK targets, with convergence in 2025, it looks like we will follow the high scenario until 2020.
- From about 2030, we would actually drop below the low scenario line.
- The cumulative emissions from being above the low line, between 2000 and 2030, would probably be compensated for if we consider that the low scenario is followed from about 2040.
- It is worth reiterating that this assumes we, the UK, must meet our emissions targets and must persuade the rest of the world to match us. Things could look optimistic looking forward to the second quarter of the century.

.jpg)
Return to main Emissions Targets page

![link to W3C validation website, which will show that the stylesheets are Valid CSS [css]](http://jigsaw.w3.org/css-validator/images/vcss-blue)
![link to information about this website [info]](../images/btn_info.jpg)
![jump up to the top of this page [top]](../images/btn_top.jpg)