Where to target our efforts
This section looks at the make-up of UK emissions. Carbon dioxide emissions from power stations and transport need to be targeted as they are particularly significant (at 48% of our greenhouse gas emissions in 2008). We will need to encourage reductions in other sectors as well though. And there is still some scope in reduce emissions of the other greenhouse gases. The EU Emissions Trading Scheme is introduced: whilst it is neither a strong nor sustainable option, the scheme is expected to be important to help us drive down emissions from power and heavy industry.
Carbon dioxide emissions by sector
In 2008 carbon dioxide (CO2) accounted for 85% of UK greenhouse gas emissions. It is therefore vital that we focus our efforts on reducing our CO2 footprint. Like all countries that are part of the Kyoto Protocol, we report our emissions to the UNFCCC United Nations Framework Convention on Climate Change. Our collection of emissions data has become more sophisticated over the years. Data is collected from across the UK, for all sectors: e.g. from pouring concrete to domestic gas use. Most of the emissions data on this page are sourced from DECC (the Department of Energy and Climate Change), who are now responsible for managing our submission to the UNFCCC.
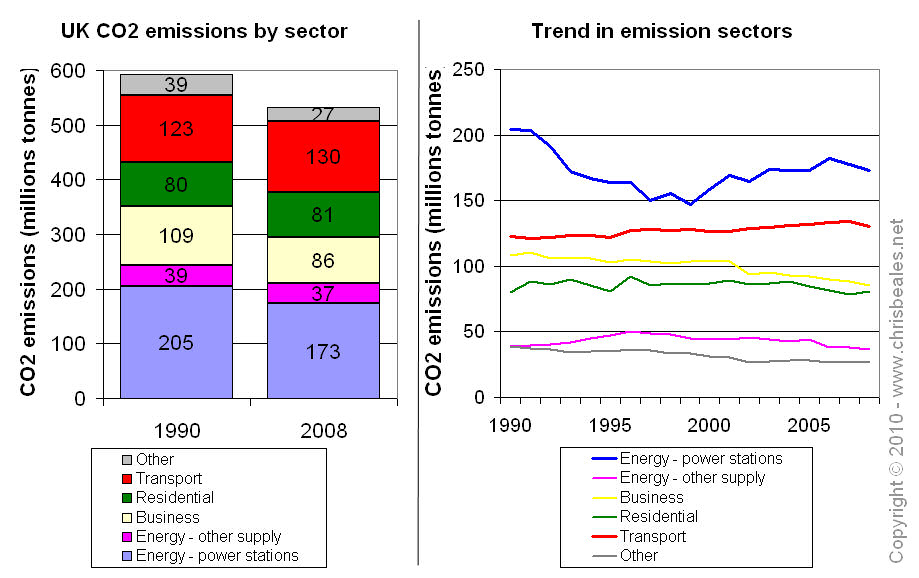
The following graphs show the split of UK emissions by source. The stacked bar graph on the left, shows a comparison between 1990 (baseline) and 2008 emissions. On the right is a chart showing the trends for each sector. Notice that:
- The Business sector looks good, with a 21% cut from 1990 emission level, this may be partly a due to the trend of manufacturing moving overseas (e.g. China).
- Sectors like the Residential sector are concerning with the lack of any clear downward trend in emissions.
- The contribution from Power stations looks encouraging, with a 15% reduction in emissions. However it is important to focus on this as it is the biggest contributor of CO2, at 33% of UK emissions in 2008.
- Transport is also concerning, being the second largest CO2 contributor, and showing a worryingly rising trend in emissions.
- Note also that we do consider change in land use (e.g. cutting down or planting new forest). At less than 0.5% however, this is a very small part of the UK carbon footprint.
![It is worth noting though that changes in land use are happening in the right direction. Whereas land use and forestry was a net contributor of 3 Mt CO2-eq in 1990, in 2008 it was acting as a 'carbon sink' equivalent to -2 Mt CO2-eq. [i]](../images/_info.jpg) .
.
Electricity generation (power stations)
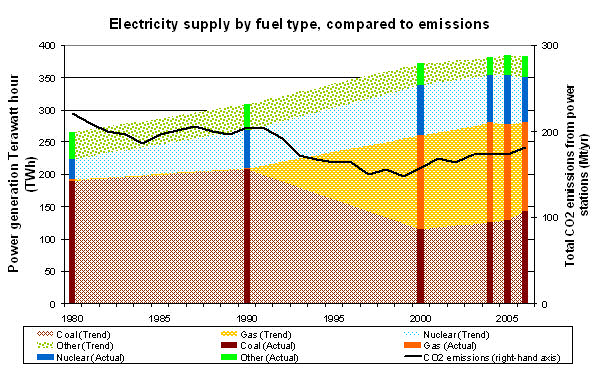
The next graph shows the trend in CO2 emissions from the Power stations sector (the black line with emissions on the right-axis) in comparison with the amount of electricity we have been generating by fuel type (shown by the coloured bands).
- Electricity supply data is from the old Department for Business Enterprise and Regulatory Reform (see http://www.berr.gov.uk/files/file39881.pdf). Note left axis in units of energy
![To convert to domestic supply units: 1 Terawatt hour [TWh] = 1,000,000,000 kilowatt hours [kWh] [i]](../images/_info.jpg) .
. - The growth in electricity supply is noticeable, with a 24% increase by 2006 over 1990 output. This is only recently starting to show signs of reaching a plateau.
- The famous "dash for gas" is very evident. Notice that electricity generated from coal + gas has increased by 34% from 1990 to 2006. It now accounts for 73% of generation. Over the same period, CO2 emissions from the power sector have decreased by 11%.
- Efficiency improvements are key to explain the contradictory trends. Particularly, the switch to gas fired power stations has allowed us to increase our power output whilst decreasing our CO2 emissions.
Transport
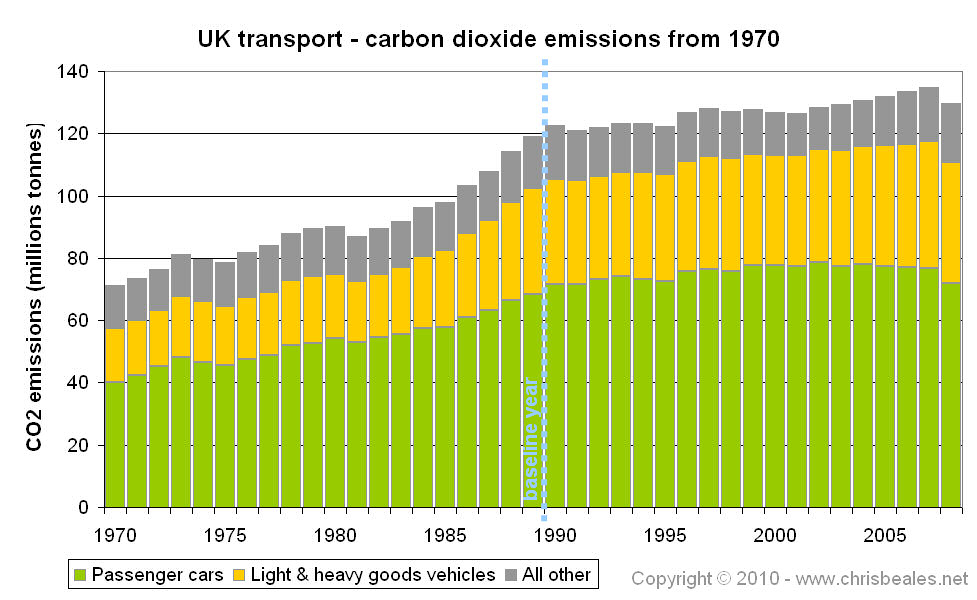
The following graph shows emissions from the transport sector. This includes: road transport, rail, costal shipping and domestic aviation. Notice that it does not include international shipping or flights. These are difficult to fairly apportion to each country reporting to the UNFCCC, ![For example: Heathrow airport is an international terminal, with people from across Europe converging to get on a flight to America. To be fair the emissions of that flight probably should be divided out between each passenger, and then attributed to the countries from which they each started their journeys. [i]](../images/_info.jpg) however a mechanism will hopefully be found in time for the next international agreement on emissions reduction.
however a mechanism will hopefully be found in time for the next international agreement on emissions reduction.
- Emissions from passenger cars make up over 55% of all vehicle emissions in 2008. The trend shows a significant rise up to the 1990's. Since then it seems to have reached a plateau but is not showing much sign of decrease.
![Note that 2008 figures are lower but this may be a consequence of the start of the global recession. [i]](../images/_info.jpg)
- Light & Heavy Goods Vehicles (HGVs) are the next most significant contributor to emissions (30% in 2008). This trend is concerning because it has risen continuously since the 1970's.
Other gases
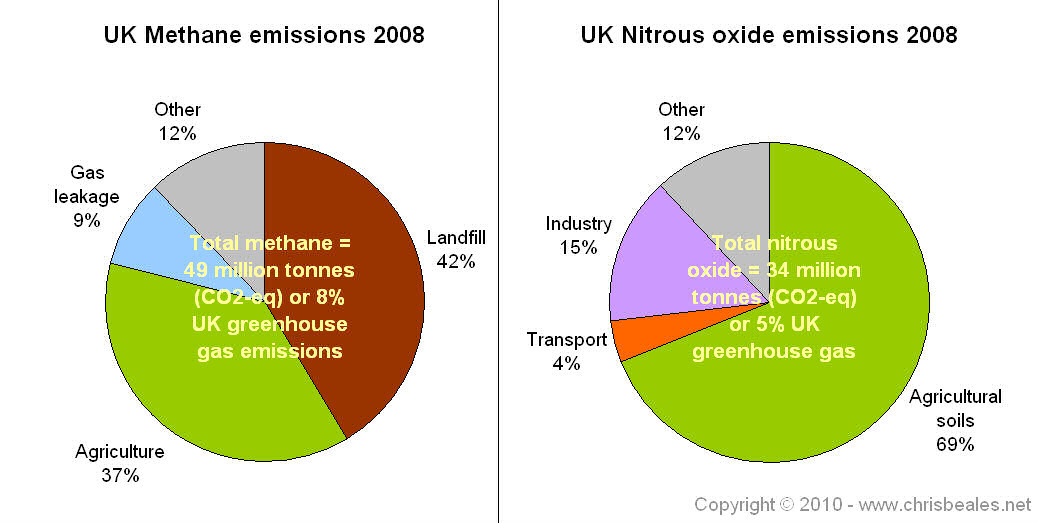
In 2008, 15% of UK greenhouse gas emissions were attributed to gases other than CO2. Whilst there is still benefit in reducing emissions of these other gases, there is an ever decreasing amount of mileage if we are to continue to meet our emissions targets.
The following pie charts show the major splits in emissions of our second and third most significant greenhouse gases, which now account for about 13% of UK emissions.
- A lot of work has already been done to reduce the methane emissions from landfill sites (notice that drive for recycling - and cutting down - our waste has been part of this improvement). There is still more work that can be done. Change in farming practices, and changes to our eating habits, may help to reduce methane emissions from the agricultural sector.
- The big issue for nitrous oxide emissions is the agricultural sector. Again, a change in farming practices may help here.
Emissions Trading
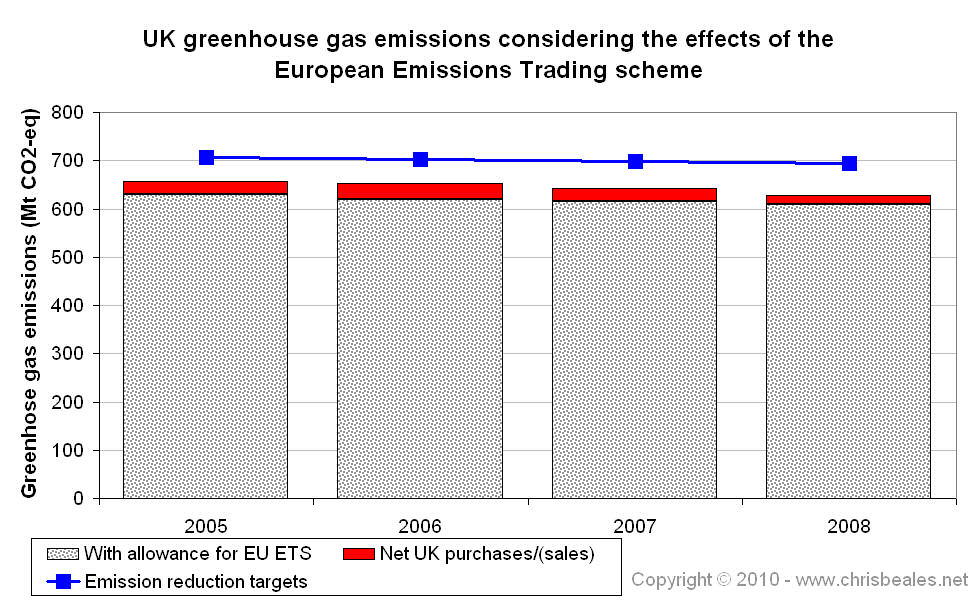
The European Union's Emissions Trading Scheme (ETS) started trading in 2005. It allows countries to buy / sell emissions with other countries from within the 27 European states that jointly negotiated the international greenhouse gas reduction targets.
- It applies to power stations and heavy industry - the big carbon emitters - which account for about 42% UK greenhouse gases; and approximately two-thirds of the EU's unilateral 20% emissions reduction target.
![Figures from the DECC website. [i]](../images/_info.jpg)
- It will include emissions from European aviation from 2012.
- It is a "Cap and trade" scheme. The cap will reduce annually by 1.74% and is expected to reduce EU emissions down by 21% by 2020 (compared with 2005). Within the annual capped emissions total, members of the scheme can trade emissions allowances with each other.
The ETS is expected to be the driving force behind a market lead reduction in emissions for the biggest polluting sectors. This could be a useful to make sure that the UK continues to meet our emissions targets. It is not a strong or sustainable way of doing so though.
- It does not show strong leadership or commitment to tackling emission reductions.
- It is an uncertain "resource", being very dependent on the actions of other countries.
- It also could get expensive, which may be an issue in the recession.
The following graph shows how the initial effects of our emissions trading have bought UK emissions down even further below our target line. At the moment the scale of trading is small: in 2008 we traded 3% of UK emissions.
.jpg)
Return to main Emissions Targets page

![link to W3C validation website, which will show that the stylesheets are Valid CSS [css]](http://jigsaw.w3.org/css-validator/images/vcss-blue)
![link to information about this website [info]](../images/btn_info.jpg)
![jump up to the top of this page [top]](../images/btn_top.jpg)