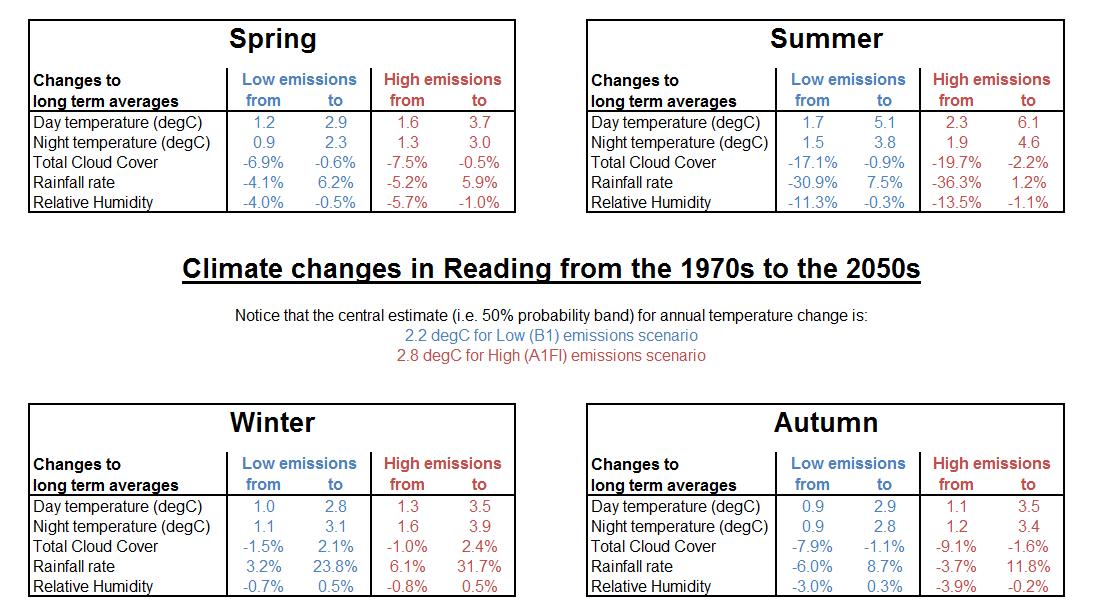
Seasonal climate changes in 2050s Reading
There is a significant amount of difference expected between the individual seasons, which you cannot understand from the crude estimates of change to average annual temperature. In Reading, we will see summer temperatures increasing more relative to the rest of the year, although it will be milder in all seasons. It looks like winter will be wetter and summer will be drier: there is more uncertainty about how rainfall will change for spring and autumn.
The following figure gives seasonal tables of expected climate change for Reading in the 2050s.
- The ranges given follow the same probability band as discussed in the Temperature changes in March page: i.e. there is a 1-in-6 chance of change being lower than the "from" figure; and a 1-in-6 chance of change being greater than the "to" figures.
- Remember that these are changes to the 30-year long term averages.
![2050s actually means the period from 2041 to 2060, and these are compared against the 1961 to 1990 baseline period. [i]](../images/_info.jpg) Actual weather will vary a lot more, as discussed in the Temperature changes in March and Temperature changes in August pages.
Actual weather will vary a lot more, as discussed in the Temperature changes in March and Temperature changes in August pages. - Notice that in between the seasonal tables are the central estimates (right in the middle of the probability band)
![i.e. 50% chance of change being less, and a 50% chance of it being greater [i]](../images/_info.jpg) of change in average annual temperatures for Reading. I have included these for comparison with other average temperature changes that we might see: for example, under the low emission scenario, global average temperatures in the 2050s are expected to rise by 1.6ºC.
of change in average annual temperatures for Reading. I have included these for comparison with other average temperature changes that we might see: for example, under the low emission scenario, global average temperatures in the 2050s are expected to rise by 1.6ºC. ![Notice that I have taken the IPCC figure of 1.3 degC rise, which is compared to a 1980 to 1999 baseline period, and I have increased it by the approximate 0.18 degC rise-per-decade so that it is consistent with the 1961 to 1990 baseline period used on this page. [i]](../images/_info.jpg) It is important to see how wide ranging the changes in seasonal climate might be compared to the simple annual average.
It is important to see how wide ranging the changes in seasonal climate might be compared to the simple annual average.

Note that: Day temperature refers to average daily maximum temperature for the 3 month season; Night temperature refers to average daily minimum temperature; and that Rainfall rate refers to change in total precipitation (e.g. rain, snow, etc).
Seasonal comparisons
Spring (March - May) - looks like it will be warmer, with a bit less cloud and lower humidity. There is uncertainty as to whether rainfall amounts are likely to change to be drier or wetter.
Summer (June-August) - will be hotter, with temperatures increasing relatively more in this season than at other times of the year. Notice that day & night temperatures look like they increase more in the earlier summer months than we saw in the detailed analysis of August temperature changes. There is a notable reduction in the amount of cloud and expected humidity levels. It also looks likely that it will be significantly drier on average (the low scenario predicts 73% chance that it will be drier); more research will need to be done to see if there are changes to extremes.
Autumn (September-November) - seems to change in a similar way to the Spring. There does appear to be slightly wider uncertainty bands for many of the climate variables, and it looks like there is a higher chance that it will be wetter in the future rather than drier.
Winter (December-February) - will be milder, more research will need to be done to check that cold snaps are less frequent and / or less extreme (I would expect so). Whist cloud and humidity look like they will remain similar to what we are used to, there is a very noticeable expectation of that we will see more rainfall. Further research will need to be done to check whether future rainfall events are expected to be more extreme, and / or more prolonged.
Differences between emission scenarios
You can see that there is generally an increase in the amount of change expected under the high compared with the low emission scenario. In most cases the uncertainty band is also wider. In some cases the difference does not look very significant, however it is important to remember the kind of trends we saw in the Temperature changes in March and Temperature changes in August pages. After the 2050s we observed an acceleration in temperature change under the high scenario, which is likely also to be seen in changes to rainfall, etc.
.jpg)
Return to main Consequences page

![link to W3C validation website, which will show that the stylesheets are Valid CSS [css]](http://jigsaw.w3.org/css-validator/images/vcss-blue)
![link to information about this website [info]](../images/btn_info.jpg)
![jump up to the top of this page [top]](../images/btn_top.jpg)