What climate change am I interested in?
To understand how climate change is going to effect me, I need to be clear to define: where (Reading, UK) and when (March & August, 2050 & 2080); and which future emission scenarios (the highest & lowest) I am interested in. Fortunately I will then be able to use the new UK climate projections to give me some detailed data on how big these changes are likely to be...and I need to be clear about what I mean by the word "likely" (the middle, 67% probability band).

Where?
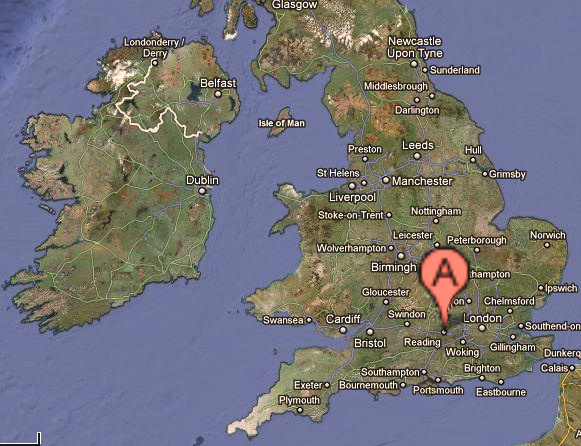
I live in Reading, a town of about 230,000 people, which is situated at the confluence of the River Thames and the River Kennet...approximately 40 miles east of London (see map). I am going to choose my home town to paint a picture of climate change. It is as good a place as any...and I'll at least find it useful! The thought processes that I need to go through will apply to you as well, so hopefully it will help you to picture how change will effect where you live.
When?
I am interested in the following decades:
- the 2050s - because I might live to see it (if I'm lucky);
- and the 2080s - which my children's generation are likely to live to see.
I know that there is a lot of information to digest (which you will see in a minute), even to understand temperature changes in a single month. To keep things simple, I am going to take a detailed look at two examples, which I am particularly curious about:
- March, which is the start of Spring - my favourite time of the year;
- August, which is the time of summer holidays - and hence memories I can compare against, of playing outside as a kid.
Which emission scenario?
.jpg)
Follow this link to see my latest investigations into Emissions Targets, and how well we are progressing against them.
Looking at how the latest international targets !['targets' is not quite the word unfortunately [i]](../images/_info.jpg) and progress, compared against the emission scenarios, the future seems to be very uncertain. I hope that things will change, and that I will need to revising this section next year with a more optimistic picture!
and progress, compared against the emission scenarios, the future seems to be very uncertain. I hope that things will change, and that I will need to revising this section next year with a more optimistic picture!
- At the moment however, we have no international agreements that would stop us from going above the highest (A1FI) scenario - so I want to look at this.
- We also have political rhetoric that tries to commit us to limit us below the lowest (B1) scenario - so I want to see what this future looks like as well.
All I can guess is that we will end up somewhere in between but I do not know where. I will therefore try and make projections for the highest and lowest scenarios and try and understand the range of possible futures.

How do I find the climate change data?
Fortunately there is a excellent source of information on how my local climate is predicted to change...
In June 2009 the UK Climate Impacts Programme (UKCIP) finished working on their latest findings for the UK. This report is available on-line here: UK Climate Projections 2009 (UKCP09). It gives access to a huge amount of data and information, about the local consequences of climate change. Notice that they have results for 3 emission scenarios (High, Medium and Low); and all of the results are available with associated probabilities, based on the strength of evidence from lots of Global Climate Model (GCM) and Regional Climate Model (RCM) runs.
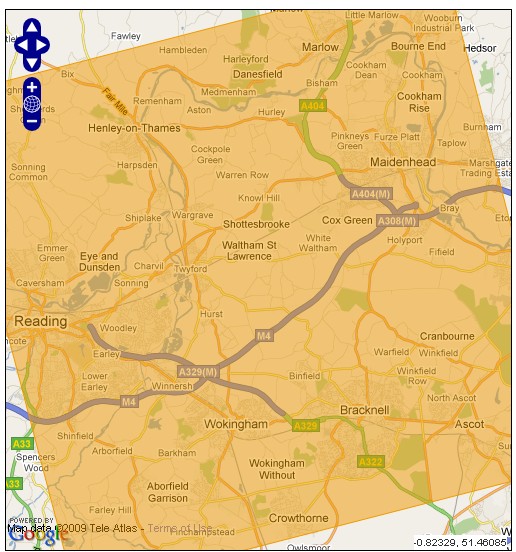
Having decided the time periods that I am interested in, and that I need to look at both the highest (A1FI) and the lowest (B1) emission scenarios, I am just about ready to delve into the piles of UKCP09 data. The climate projections have been calculated for 25 kilometre squares: you can see from the adjacent map the square that is most appropriate for Reading.
...and what likelihood am I interested in?
The final thing I need to consider is what probability levels are appropriate. The UKCP09 projections are all probabilistic, which makes them a little complicated so, to try and keep this as real and easy to understand as I can, I am going to think in terms of dice...

Probability dice - Climate change projections are fundamentally uncertain. However, the UKCP09 report does try to estimate the probabilities behind each change. For example: "...what probability is there that the temperature will change by at least 2ºC by March 2050...?". These probabilistic estimates are not perfect understandings how likely each degree of change is, but they are the best that we have. Baring this in mind, I have decided to use a central, 67% probability band to look at a reasonably likely range of climate change. This is similar to rolling anything between 5 and 9 on two dice. If the projections are accurate, there would be a 1-in-6 chance of that the change is lower / less than the bottom, and a 1-in-6 chance that it is greater / higher than the top of the band.
.jpg)
Return to main Consequences page

![link to W3C validation website, which will show that the stylesheets are Valid CSS [css]](http://jigsaw.w3.org/css-validator/images/vcss-blue)
![link to information about this website [info]](../images/btn_info.jpg)
![jump up to the top of this page [top]](../images/btn_top.jpg)