Temperature changes in August
To understand the thought processes behind this page, please make sure that you have read the Temperature changes in March page first...
Even by 2050 we could experience heat waves, with hottest day temperatures that reach 40ºC in the shade. By the 2080s there is a big difference in the temperatures that we are likely to see by following the high, rather than the low scenario. It looks like it could get uncomfortably hot compared to what we've been used to.
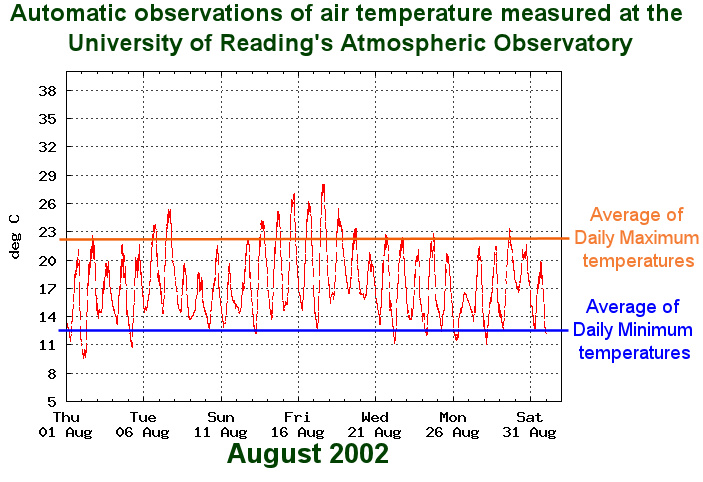
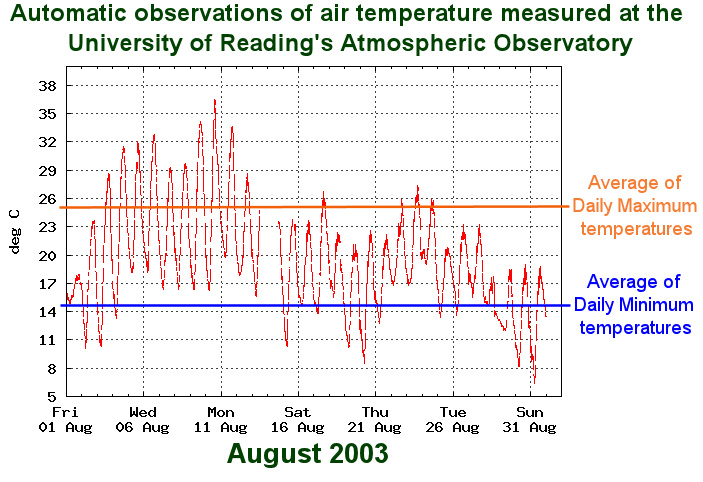
August is not necessarily the hottest month of the year in Reading. For a summer holiday it can be disappointing, for example 2009 was a pretty poor showing. On the other hand, early August 2003 was shorts, sandals and t-shirts weather...too hot at times! I have chosen to plot this year below; alongside August 2002, which had average day minimum and maximum temperatures close latest 30 year averages.
- Notice how much higher the average maximum and minimum temperatures were for 2003 compared to 2002. This is despite the notably cooler temperatures in the second half of August 2003. If the heat wave had lasted longer, average temperatures would be much higher.
- There are big variations in August 2003 temperatures, with day maximums between 18ºC and 36ºC. This is important to consider when thinking about the change to averages that we see through the climate change predictions. Behind the single averages for the 2050s or 2080s could be months with wide extremes.
|
|
Please notice that the March and August data on this page were downloaded in February 2010. I am using them for illustrative purposes only. The copyright is retained by the Department of Meteorology at the University of Reading.
Long term averages & Comparison between years
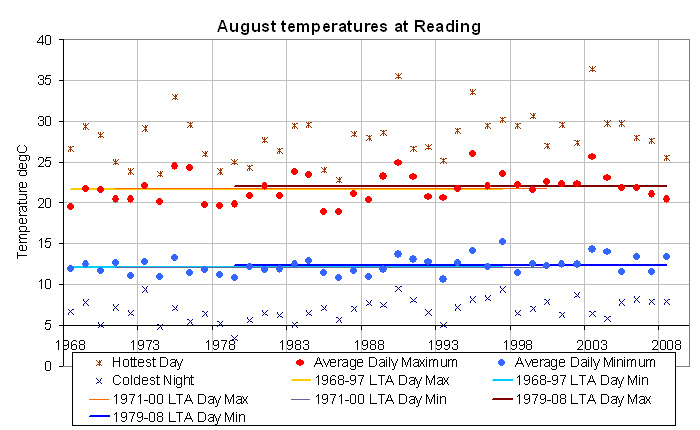
- There is a similar range of variation in the monthly averages, between years, as there is in the March comparison. There is more variation in the hottest day temperatures, from about 23ºC to 36ºC.
- You can see that 2003 had the second highest average daily maximum in the last 30 years; however it recorded the highest hottest day temperature.
Projections for August
The baseline, 1961-1990 long term averages for our 25 km square are as follows for August: average daily maximum is 21.2ºC, and average daily maximum is 11.0ºC. As with March, it is worth noting that these averages may be slightly different than for the weather station at the University of Reading.

UKCP09 average daily maximum temperatures in August - Temperatures increase through time but under the low scenario, there is a noticeable slowing after about the 2040s; however there is a marked acceleration after about the same period, under the high scenario. Probability bands in the 2050s are fairly similar in profile for all emission scenarios. By the 2080s there has been a significant move in the higher scenarios, which are wider and flatter. Significantly higher temperatures lie beyond the high end of our chosen 67% band (for example averages could be reach over 34ºC by 2080 under high emissions). Spatially, you can see that temperatures tend to increase towards a peak approximately over London. The August 2080 temperature curves are of similar width to the June-August Summer season but they are skewed more towards lower temperatures, hence the change in central estimates for temperature of the hottest day is likely to be up to a degree lower at: approx 1.5ºC warmer under the low scenario and approx 3ºC under the high scenario. Notice that in either scenario, average hottest day temperatures could be over 10ºC higher than the 1970s.

UKCP09 average nightly minimum temperatures in August - Similar to the maximums, average minimum temperatures increase through time: but under the low scenario, there is a noticeable slowing after about the 2040s; and, under the high scenario, and they accelerate after about the same period. By the 2080s, the probability band for the high scenario is much wider and flatter than the low. Averages for night temperatures could reach over 20ºC under the high scenario. Spatially, you can see that temperatures increase towards the south-east of England. August 2080 temperature curves are very slightly wider than for the June-August Summer season but they are skewed more towards lower temperature changes. The change in temperature of the coldest night is likely to be approximately: approx 1.5ºC warmer under the low scenario and approx 2.5ºC under the high scenario.
Visualisation
The following two boxes give you a picture of August in the 2050s and in the 2080s. As with the March page, you can see the two 67% wide probability bands: blue bars for the Low emission scenario, and red bars for the high scenario. August 2002 is plotted under each graph for comparison; and data is summarised underneath each graph.
- It is interesting to notice that the range of temperatures for the low scenario in the 2080s will be met 30 years earlier under the high scenario.
- Most concerning for me is to think about the potential for future heat waves. Analysis of hottest days under the high scenario, suggests that we could easily see temperatures in the mid 40sºC in 2080s August. This is hot for a Mediterranean island...it will be extremely uncomfortable in Reading's town centre!
- By the 2050s there is not too much difference between the scenarios. In either case long term average day max temperatures could easily be 3ºC warmer. This would suggests that we will see warm years with average temperatures of over 28ºC; hottest day peaks reaching over 40ºC in the shade.
- If we are unlucky, and end up at the high end ,of the 67% probability band, of the high scenario: we could experience long term average day max temperatures of over 30ºC. Notice that this is nearly 8ºC higher than August averages for the past 30 years, and would suggest that hot years (equivalent to 2003) have average day max temperatures that are something like 33ºC. Imagine what the day-to-day temperatures would look like if you move the gray day max bar up to there...
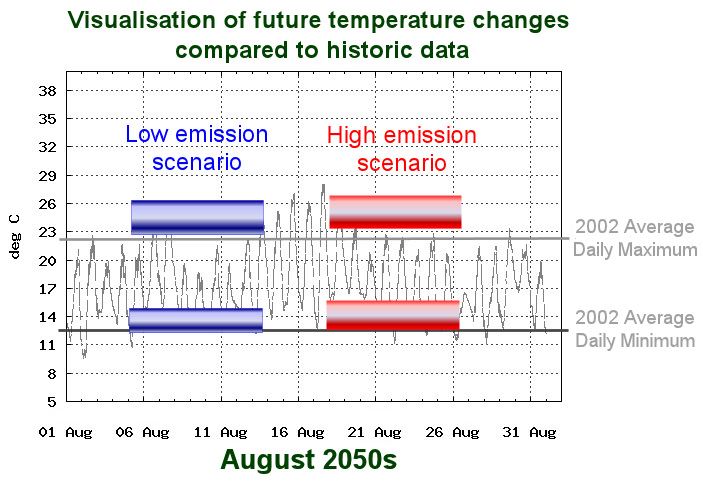
By the 2050s, under the Low emission scenario, there is a 67% chance that average temperatures for August:
By the 2080s, under the High emission scenario, there is a 67% chance that average temperatures for August:
|
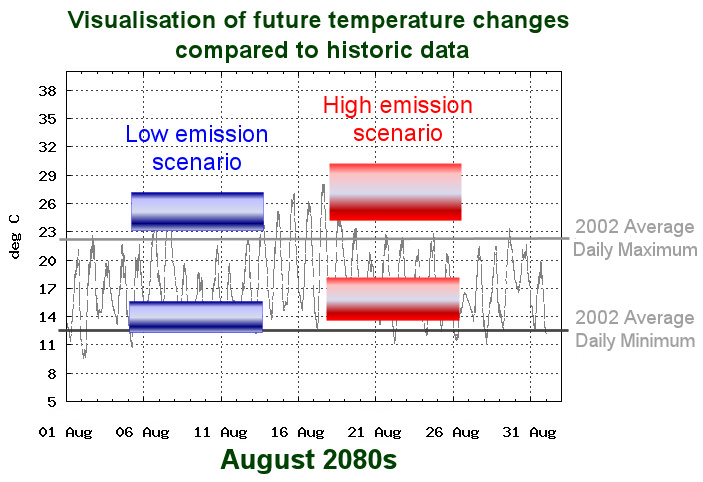
By the 2080s, under the Low emission scenario, there is a 67% chance that average temperatures for August:
By the 2080s, under the High emission scenario, there is a 67% chance that average temperatures for August:
|
.jpg)
Return to main Consequences page

![link to W3C validation website, which will show that the stylesheets are Valid CSS [css]](http://jigsaw.w3.org/css-validator/images/vcss-blue)
![link to information about this website [info]](../images/btn_info.jpg)
![jump up to the top of this page [top]](../images/btn_top.jpg)